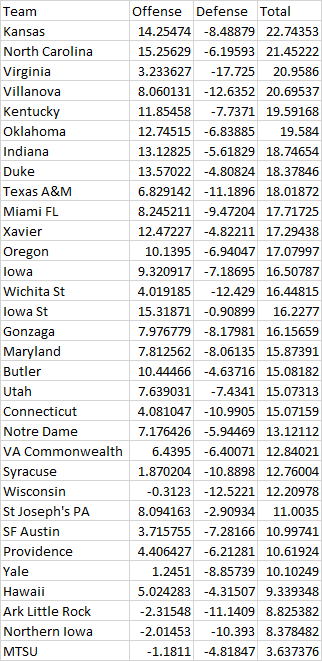
Updated strengths for the winning teams after round 1. Not a ton of movement compared to the post pre-tournament, but some teams jump .5-1 points in the total column and there is a slight re-ordering of teams.
Category Archives: Tips
Offense/Defense Strength for March Madness Teams
Last year, I posted the offense/defensive strengths for each NCAA tournament team, based on the scores of all NCAA games throughout the season. Below, you will find the values for 2016 March Madness.
Some things to note:
1. 6 tournament teams are below NCAA Division 1 average.
2. The top 11 teams are within 5 expected points of each other.
3. Michigan St is the 2nd best team and got a 2 seed. West Virginia is the 3rd best team and got a 3 seed.
4. Oregon is the 18th best team and got a 1 seed.
5. Purdue, Vanderbilt, Gonzaga, Michigan, and Wichita St are quite under-seeded.
6. Xavier, Oregon, and Utah are quite over-seeded.
7. The Kentucky (19.2 points above average) and Indiana (18.5 points above average) matchup in the second round will be a good game.
Benefits of Graduate Teaching
More students become majors. Grad students who teach more are more likely to get a job.
Game Theoretic Baseball Catching
I heard about Zack Hample and his thousands of game balls many years ago. Now he has over 8,000 and caught A-Rod’s 3000th hit (a home run) this year.
You might be able to increase your odds by moving to areas of less competition, even if it’s an area where fewer balls are hit.
Some of Hample’s suggestions:
1. Hample suggests going to batting practice before the game begins and finding an empty row with aisle access. You want to be able to move both left/right as well as up/down in the seats so you can cover more room (around 5:25 in the video).
2. Learn foreign languages! Now this is thinking creatively. Baseball players often toss balls up to fans if you ask them nicely. Hample figured that foreign players would be more receptive if he asked in their native tongue. He’s learned how to ask “can you throw me a baseball” in over 30 languages (around 6:45 in the video).
3. Look at ESPN’s home run tracker. You can look up any player or any stadium to see where home runs are hit in a scatterplot. There are statistical patterns so you can choose your seat accordingly to increase your chances of catching an important home run (around 6:10 in the video).
(via Mind Your Decisions)
How to Win
From a 2004 paper by Gaba et al:
If a contestant has the opportunity to modify the distribution of her performance, what strategy is advantageous? When the proportion of winners is less than one-half, a riskier performance distribution is preferred; when this proportion is greater than one-half, it is better to choose a less risky distribution. Using a multinormal model, we consider modifications in the variability of the distribution and in correlations with the performance of other contestants. Increasing variability and decreasing correlations lead to improved chances of winning when the proportion of winners is less than one-half, and the opposite directions should be taken for proportions greater than one-half. Thus, it is better to take chances and to attempt to distance oneself from the other contestants (i.e., to break away from the herd) when there are few winners; a more conservative, herding strategy makes sense when there are many winners.
Applications to academia:
For example, if a school wants to be more innovative and nurture high-risk, high-payoff “big ideas,” it should decrease p (of tenure) for junior faculty…
There are also implications regarding the type of individual who might join the organization. For example, consider a new Ph.D. entering academia with a choice between a school with moderate research expectations and reasonably high p (of tenure) and a top research school with low p but greater rewards associated with winning the tenure contest. An organization wanting to minimize the chance of very low performance and/or to attract people who prefer to stay on well-trodden paths should set p high, whereas an organization wanting to increase the chance of especially high performance (at the cost of an increased chance of especially low performance) and/or to attract people who are competitive and like the challenge of striking off in new directions should set p low.
Saving Details from Research Papers You’ve Read
I read 212 research papers in the 12 months following June 2014. Some were for coursework. Some were for research. Some were just because I felt like it.
As anyone who knows me will tell you, my memory for details is not very good. I’m more of a big picture person. So I worry that I won’t retain much from this giant expenditure of time in reading research papers.
I’d like to describe my current system for saving information from research papers for later use. I have a few use cases for this effort:
Use Case 1: Upon writing a research paper, I want to know which papers I’ve read about the topic so that the literature review moves more smoothly.
Use Case 2: When I go to interview for a job at a university, I’d like to know which papers I’ve read from the faculty there. This may provide opening discussion topics.
Use Case 3: I’d like to save my ideas for follow-up actions (after reading papers) in one place.
Use Case 4: When topics in diverse fields reference the same topic, I’d like to be the person to connect the fields.
LOW TECH SOLUTION:
Last year, I saved the first page of every research paper I read in a binder with my hand-written notes on the first page. This provides a form of storage, but it is not at all searchable or cross-reference-able.
HIGH TECH SOLUTION:
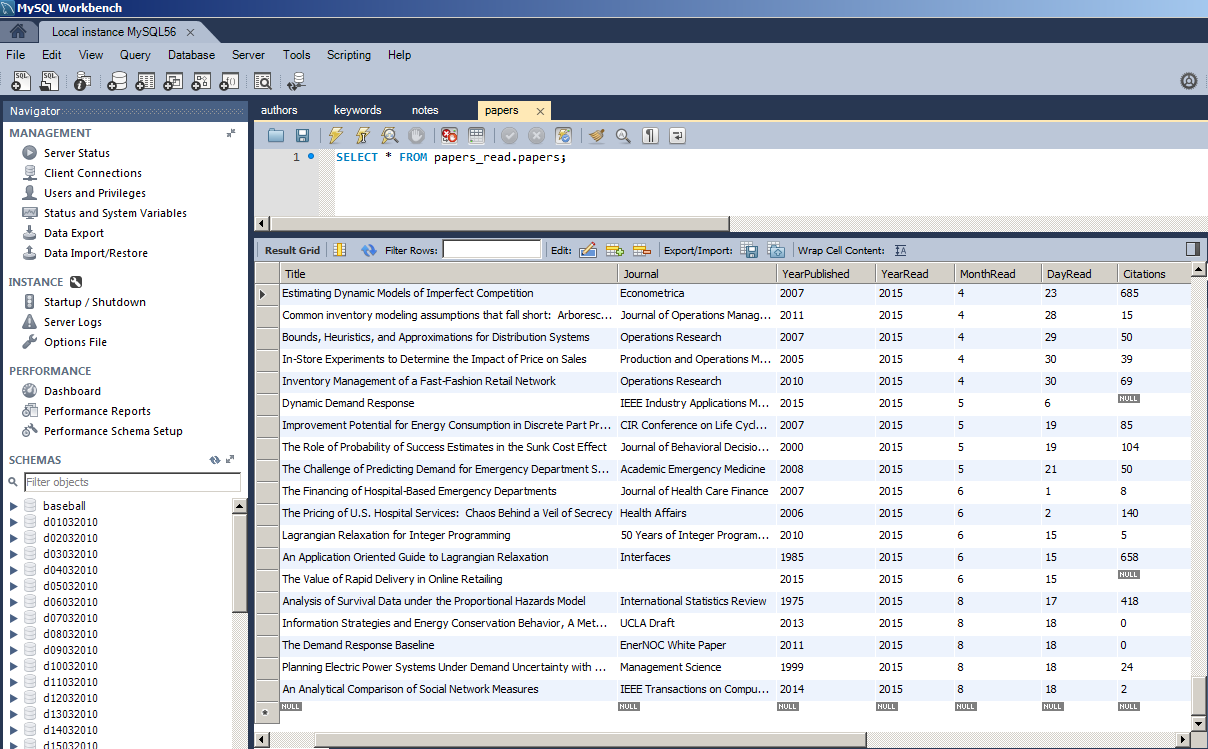
This year, I designed a template that contains all the information about a paper that I want to save. I then designed an import process to port this information from the template (text document) to a database that I can query easily. Here is my process for that, including code and database setup:
1. Install MySQL (https://www.mysql.com/) locally on your most-used computer.
2. Create a database called “papers_read”.
3. Run the code in the attached files to create your database tables (The code is attached here as .txt because my website doesn’t allow me up to upload .sql. Just fix the extension so it is “.sql”): papers, authors, keywords, and notes.
4. Create a folder on your computer called “Paper Notes to Upload”. Put the following template file in the folder: template.
5. Install Python and the related library MySQLdb.
6. Save this Python code wherever you save your code: addNewFromTemplate (again, the extension has been changed to .txt for security reasons. Rename to .py). Update the “folder_to_add” directory in the code to point to the folder you created in step 4.
Now, whenever you read a paper:
A. Fill out the template with the paper details, and save the text file as something OTHER than ‘template.txt’ in the folder created in step 4.
B. When it is convenient (there may be multiple files to upload in the “Paper Notes to Upload” folder), run the Python code. This will upload your notes to the database.
C. Move the paper notes out of “Paper Notes to Upload” folder after uploading. If you run the code again with them still in the folder, they will be uploaded again.
Some notes on the template:
-Do not use colons in any of the fields you save, as the code uses colons to parse the document. If the title of the paper has a colon in it, use a comma instead.
-I grab the number of citations from Google Scholar by searching for the title of the paper.
-“Comma-separated Keywords” is for you to list the keywords in the paper, with a comma between each.
-In the authors section, be sure to delete any extra/unused author spaces. Feel free to add more if necessary, following the pattern of the first 6.
-Under Reading Details, the Hours to Read is how long it took you to read the paper in hours (can be decimal). The Not Read is a place to list sections/pages not read. The Skimmed is a place to list sections/pages quickly skimmed for which another read would be necessary to understand all the details. Reason Read is a reminder of why you read the paper. Methodology Used lets you list the methods used in the paper (i.e. survey, lab experiment, mathematical model, optimization, etc.), if that is relevant to your work.
-Under My Notes, “Keywords for me” lets you list more keywords that the paper did not list itself (comma-separated, again). FollowUp lets you list actions that should be done after reading the paper. Note1 through Note5 let you list notes to yourself about the paper. Limit each note to 200 characters and do not add more. No need to delete unused notes.
I hope this helps. It’s the process I use. Feel free to alter to fit your needs. Let me know if you use it and if you have any questions. All the code is my own and it is fairly fragile (but works for me); feel free to let me know if you have issues or a better solution.
Code Monkey Monday- Hiding Excel Equations in Cells
This isn’t a particularly high-tech post, but it helped me out in tricking innocent bystanders of a cell’s true intention. Suppose you are using Excel and want to show someone a nonsensical output from a cell evaluation. You type in something innocuous, like =rand(), which should give a random number between 0 and 1. If you want the “random” number to always be between .5 and .75, however, you could type =rand()*.25+.5. In my case, I wanted to show someone the equation “=rand()” but the output from “=rand()*.25+.5”, so that whenever I updated, it would give a number between .5 and .75. The observer would be confused and hilarity would ensue as the “random” number always falls between .5 and .75. To do this, type “=rand()” at the far left of the cell equation box, like normal. Then put a bunch of spaces until you get to the middle of the equation box, and put “*”. Then put more spaces until you are off the initial screen and type the rest of the equation “.25+.5”. Now, when the equation is viewed, the observer will only see the “=rand()”, unless they are looking very closely and notice the odd multiplication sign in the middle of the line. In my experiments, I have found that Excel will delete your excessive spaces if you only put “=rand()” on the far left and “*.25+.5” off the screen. For some reason, the spaces are not deleted if you type something in the middle of the equation box. Use this information as you will.
Life Tips- Inexpensive Giant Whiteboard
An 8’x4′ whiteboard can cost hundreds of dollars commercially. That’s no good. We like whiteboards, but not spending money.
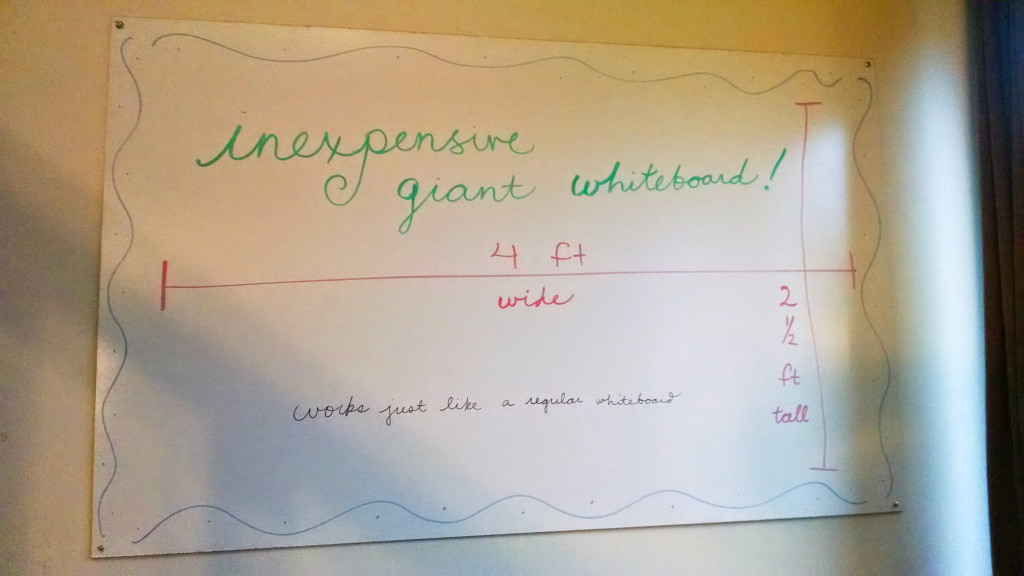
Here’s our inexpensive work-around. Buy an 8’x4′ slab of white hardboard panel at Lowe’s or Home Depot. Each board costs about $13. This product is made for cheap showers, mud rooms, laundry rooms, etc., in order to be water-resistant and minimize staining.
We didn’t want a single 8’x4′ whiteboard, preferring 3 large whiteboards: one 3’x4′ and two 2.5’x4′. Lowe’s was happy to cut the board with their saw for us. Their saw is not appropriate if you need super-precise measurements, but it works for something like this.
We hung one whiteboard in the kitchen for Maria to keep a weekly menu and shopping list. We hung one in the living room near the stairs (shown above) for any group brainstorming or Pictionary. And the biggest one went up in the office for me to write math on.
The hardboard seems to approximate an expensive whiteboard pretty well. Most dry erase markers write and erase well. Here is the above picture half-erased:
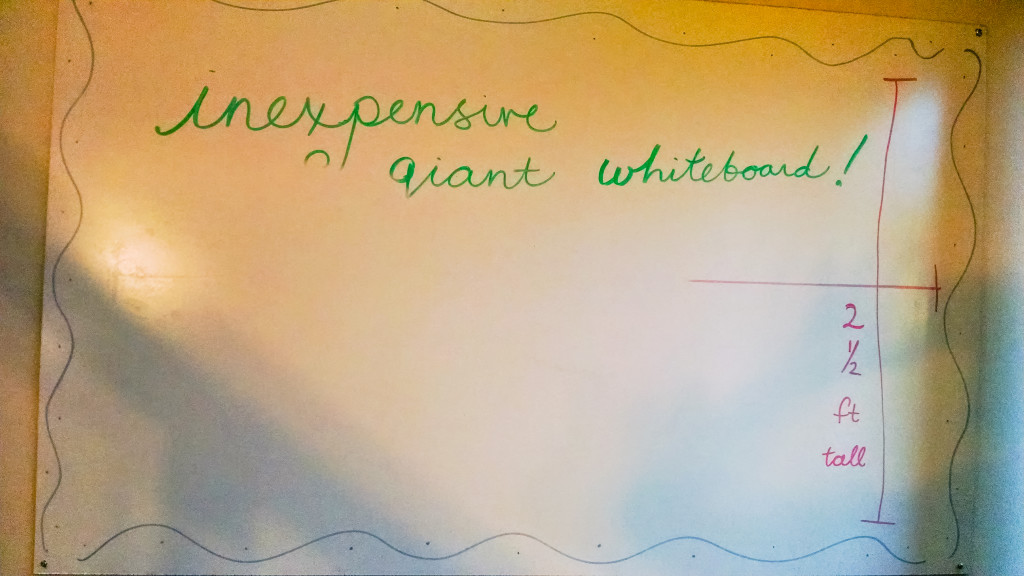
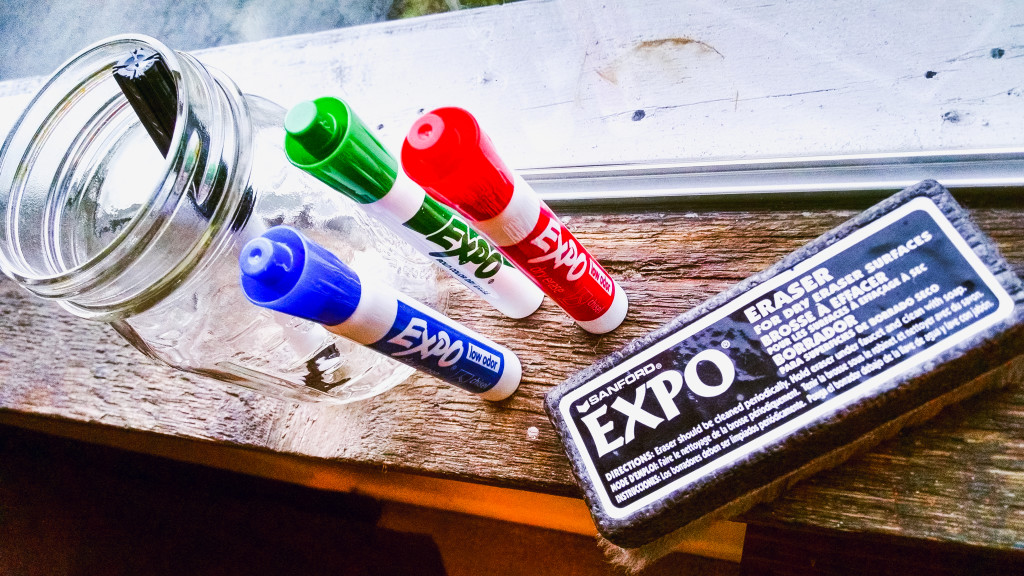
We use normal dry erase markers on the boards. We’ll probably put a tray under the boards to hold them at some point.
I’m sure you could get fancy and put a boarder on the whiteboards. We decided to just screw the boards straight to the wall. Close-up of the screw in the corner:
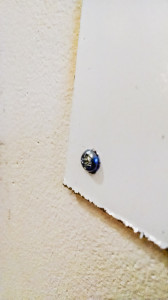
You can see that the saw at Lowe’s will leave a bit of a rough edge where the board is cut. It’s not very noticeable in person, though.
The white boards have been up for about a week and are working well. I’ve heard that the hardboard tends to stain over time, so we bought two 8’x4′ panels, cut to the same size, from Lowe’s. So in a year or two, if the boards are stained, we can easily replace them. Alternatively, if we like them so much that we want more, we can hang more whiteboards.
I got this idea from a post at lifehacker.
Life Tips- Don’t Touch the Poison Ivy
Seriously. I’m just getting over a two-week itchy hell. Probably pulled some poison ivy vines in my new garden bed (we moved in August), got the oil on my gloves, and then touched my wrists, stomach, and legs. After a week of itchiness, I gave up and went to the medical center to get steroids to stop the allergic response. I’m just now starting to feel better. For about a week, I couldn’t sleep for more than an hour at a time because the itchiness would wake me up whenever my legs touched each other.
If you live in Bloomington, be sure to know what poison ivy looks like. A good primer.
Code Monkey Monday- Notepad++
If you like to read data in from text files or save lots of data to text files, you’ve probably discovered that Window’s default text reading program, Notepad, sucks. It can’t open large (MB or larger) text files, sucks at formatting, and seems slow. I prefer the freely downloaded program Notepad++. It can handle large files with ease, allows multiple text files to be open in the same program, highlights all equivalent words if a word is highlighted, gives line numbers, and probably has a ton of other capabilities that I’m not familiar with. You should upgrade to Notepad++.
