Category Archives: Sports

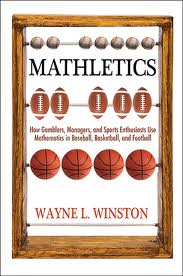
Book Review- Mathletics

Mathletics: How Gamblers, Managers, and Sports Enthusiasts Use Mathematics in Baseball, Basketball, and Football
By Wayne Winston, 2012 edition

mathletics

I met Wayne in October 2013. I knew that I had one of his books about operations research, but didn’t know much about him. After meeting with him and doing a little research on my own, I’ve learned that he has written an infinite number of books and that he is very skilled at Excel and at sports analytics (among many other things). This book gives intuitive ways to model sports questions and perform analysis with Excel. Example questions include:
-Should we go for the one-point or two-point conversion?
-Should we foul at the end of a basketball game in which we are up 3 points?
-How do different baseball ballparks affect game outcomes?

I’m not a huge fan of analysis in Excel, but Wayne is a wizard at it. I prefer to do a lot of customized number crunching via a programming language (Python/R/Matlab), as opposed to massaging Excel to get what I want. However, this book gave me a lot of ideas for future analysis. It’s kind of a tough read, in that it has 51 chapters over 340 pages and starts/stops thoughts pretty quickly. There are also a lot of editing mistakes in my version, which can sometimes be confusing if you’re not paying attention. I read Mathletics over the span of about 8 months, starting and stopping frequently. I’m glad I finished it, though, because some of the best chapters are in the last part of the book.
Sports Betting Basics

Betting the spread: If the Bengals are favored to win by 7, they are listed as -7 on the betting sheet. That means, if you bet on the Bengals to cover the spread, they have to win by more than 7 for you to win the bet. If they win by exactly 7, the bet pushes and you get your money back. If they lose or win by less than 7, you lose the bet. Similarly, if you bet on a team that is +3.5, the team you bet on either needs to win or lose by 3 or less for you to win the bet.

Most bookmakers give 11-10 odds. So you bet $11. If you win, you get $21 back (your $11 plus $10). If you push, you get your $11 back. If you lose, you get nothing.

Over/Under Line: You can also bet on the total number of points that will be scored in a game. If the Over/Under line is 51.5, you can bet the “over” and win if 52 or more points are scored in the game. Odds given are still 11-10.

Money Line: Suppose you just want to pick the winner of a game, and you don’t want to worry about the spread. You can bet on the money line. The favorite in the money line is listed with a negative value, for example, -130. In this case, you bet $130 to win $100. If the favorite wins, you get $230 back (your $130 plus $100). If the favorite loses, you are out $130. The underdog is listed with a positive number, e.g. +200. In this case, if you bet on the underdog, you are betting $100 to win $200 if the underdog wins.

Baseball: Because the outcome of a baseball game depends heavily on the starting pitchers, the starting pitchers are listed with the bet. If either of those pitchers does not end up starting the game, your bet is a push and your money is returned.

Parlay: A parlay is a selection of two or more bets, all of which must win for the parlay to pay off. In horse racing, you will often see this as the “Daily Double” or something similar. If your parlayed bets are separate in time (one after the other), you typically get better odds by making the first bet and then re-betting all of your winnings on the second bet, as opposed to wrapping them in a parlay.

Teasers: Teasers involve you betting against a modified spread on two or more games. For example, suppose the Colts are -8 favorites and the Bengals are -3 favorites. A 7 point teaser involving the Colts and Bengals would have you bet on the Colts at -1 (-8+7) and the Bengals at +4 (-3+7). So you are given 7 points on top of the spread for each game, but you have to win against BOTH modified spreads to win the bet. If either game pushes on the modified spread, the teaser bet pushes.

sports_betting_logo

How to bulk download Batter vs. Pitcher Data

I worked on a project in a Complex Systems class where I wanted to know if there was any value in looking at the network of at-bats in baseball. To create this network, I assumed that if a batter got on base via hit, HBP, or walk, the batter won the at-bat and I drew a link from the pitcher to the batter. If the pitcher got the batter out, I said the pitcher won the at-bat and drew a link from the batter to the pitcher in the network. This created a directed graph that I could run networked statistics on, such as PageRank. I wanted to know how well the rank of a player in summary statistics (ERA, AVG, OBP, WAR, etc) matched up with the rank of the player in PageRank. PageRank, in this context, puts value upon beating other players with high PageRank. So, when playing the Dodgers, getting a hit off of Clayton Kershaw last year was worth more than getting a hit off of Chris Capuano. Did good players overperform or underperform against other good players? Does this have value for predicting playoff success? These were some of my questions as I started my study.

To get results of batter/pitcher matchups, I crawled Baseball-Reference.com. Their Play Index Tool lets you look up the results of any players’ batting/pitching matchups, possibly filtered by year. I wanted to download every at-bat for the year 2013.

To begin with, I’m not sure Baseball-Reference.com wanted me to crawl their records. They have disclaimers against this sort of bulk downloading, but I was using the data for a personal project and didn’t profit from it, so I went ahead. They didn’t kick off my IP as I went about crawling/downloading these matchups.

My code for this project is in Python. I used the screen-scraping package Beautiful Soup.

I first had to grab the usernames for all players in the majors in 2013. I went to this page to get the batters and this page to get the pitchers. Looking at the page source for the pitching page, you notice that the usernames start around line 1727. Download the page source for those pages and use some logic to grab all the usernames for pitchers and batters. Here is my ugly code to parse the usernames.

Once you have the usernames, you’ll want to crawl Baseball-Reference.com to get matchup data from every batter. Unfortunately, a batter’s matchup data (like this for Barry Larkin) creates the same page source whether you filter by year or not. Filtering by year only dynamically changes what is shown on the screen; it doesn’t change the page source, which is what we are going to crawl. So we have to use three steps to get only 2013 data:
-Parse the page source for a batter’s alltime matchups to see which pitchers he ever faced
-For each pitcher, see if that pitcher is in the list of 2013 pitchers
-If it is, crawl ‘http://www.baseball-reference.com/play-index/batter_vs_pitcher.cgi?batter=’+batter+’&pitcher=’+pitcher to get the line related to 2013. Add this line to your statistics that you are keeping.

Here is my Python code to download all at-bats from 2013. You’ll notice that I import urlopen from urllib2 to tell Python to open the webpages of interest. Then I use Beautiful Soup to parse the page source. Throughout the code, I added in lines like “time.sleep(random.random()*10)” from the time package to make the code delay a random amount of time. This kept me from overloading Baseball-Reference.com with requests and hopefully kept me from pissing them off. If you’re interested in using the code, note that you’ll obviously need to change your input/output folders to match your computer.

Hope this helps. I know it’s not 100% complete in its description, but post in the comments if you’re confused in some way.

Soccer Kids need to work on their spacing and marking

Kids play blob-ball soccer. They clump together. They don’t spread out. And they don’t stay with people that don’t have the ball. And thus, 55 kids cannot stop 2 pros.

https://www.youtube.com/watch?v=XICoCI20o-E

If your kids learn the concept of spacing by the time they are 5, they will be the leading goal scorer and goal stopper on their team.

Also, for good measure, fencing against a crowd:

https://www.youtube.com/watch?v=PgKg0Hc7YIA

Crazy Japanese.

Betting on Underdogs in the NFL

I recently read the paper “Herd behaviour and underdogs in the NFL” by Sean Wever and David Aadland. It describes the phenomenon whereby bettors overvalue favorites in the NFL. They speculate briefly that this is due to the media and analysts over-hyping certain popular teams and under-estimating the parity that exists in the NFL. They create a model that suggests that betting on certain longshot underdogs will result in a positive expected betting profit. Because you typically wager $110 to win $100 when betting against the spread, you have to win more than 52.38% of the time to make money.

They fit their model on data from 1985-1999, and the model recommended betting on home underdogs when the spread was +6.5 or more and away underdogs when the spread was -10.5 or less. If they had used this betting strategy from 2000-2010, they would have made 427 bets, of which 246 would have won. That’s a winning percentage of 57.61%. If they bet $110 on each of those 427 games, they would have made $4690 over the 10 years, thus returning about $11 profit on each $110 bet. That’s a 10% return on investment, if I’m not mistaken. Pretty impressive.

sports_betting_logo

Sacramento Kings Crowdsource Draft Analytics

Painfully interesting mini-movie from Grantland about the Kings’ GM crowdsourcing some of their draft analytics to get fresh ideas.

https://www.youtube.com/watch?v=OuwvsZOvcms

It’s a deep draft. But with my minimal analysis, I don’t seem a huge difference in player potential from the ~4-~20 range. The Kings have the 8 pick, right in the middle of the “really good, but not necessarily great” range. If they can identify some value picks toward the end of the lottery or the late first round, I think it makes sense to move down from the 8 spot if they can get 2 first round picks in return. But I doubt anyone will offer that. Looking forward to seeing what happens in the draft.

Scout Scheduling

Interesting cover story in the most recent Analytics magazine from INFORMS. It tells the story of how The Perduco Group, a small defense consulting firm out of Dayton, Ohio, started offering services in the field of sports analytics. Yes, right now it appears the firm only has one lead analyst in the sports realm, but they still have a variety of interesting services/offerings.

The most interesting offering in the sports realm was in the scheduling of the travel of scouts. It makes sense that you would want to maximize the time your scouts spend viewing high value recruits while minimizing travel costs. Once schedules and players of interest are inputted, it seems like a great area for automation/optimization. Great idea.

A small company that focuses on defense and sports. Seems right up my alley.

sports scheduling header
(Image from The Perduco Group’s website http://www.theperducogroup.com/#!scout-scheduling/c1gq4. Click on the image to see it a bit larger.)