Guess the Correlation.
Simple game. Builds some statistical knowledge by visualizing what different correlations look like.
Guess the Correlation
Leave a reply
Guess the Correlation.
Simple game. Builds some statistical knowledge by visualizing what different correlations look like.
![]()
Interesting talk at the Bloomington Data Collective Meetup last night by Zach Dwiel of Plot Watt. Plot Watt uses energy sensors in households and restaurants to find opportunities to save energy. In restaurants, the use cases might be
-discovering that the restaurant’s outdoor lights stay on all night despite the restaurant closing at 10pm
-noticing when the fryer is left on after closing and alerting management
-realizing that the appliances in use are much less energy efficient than similar appliances at other locations
-determining poor installs that are costing energy
-finding poorly specified defaults on the HVAC or refrigeration units.
Zach is part of the software team that is in charge of dis-entangling the differnet signals in the electric load to determine when specific appliances/lights/HVAC are clicking on/off. This is a very difficult problem, and the academic literature has been limited by solid “truth” examples from which to learn/train. Zach discussed how Plot Watt is using machine learning to try to get at the problem. They may have the most data on this problem of anyone.
Related: It looks like a startup may be trying to automate this approach and bring it to more households.
Thanks to Crisson for the invite to the meetup.
![]()
I thought the conference went relatively well. I was very busy, with an energy talk on Sunday, sports poster on Monday, healthcare talk on Tuesday, and call center talk on Wednesday. All the talks went well and were pretty well attended (20-30 at each).
Maria was able to attend the conference as well, and she attended a mix of information systems talks and sports talks. We explored Philly on Saturday (Halloween), seeing the art museum (Rocky steps), Love sculpture, and Ben Franklin statue/museum during the day and doing a ghost tour at night (saw Independence Hall). Philly has a lot of history, but seems like not a great city nowadays. We had a few cheesesteaks, but couldn’t make it out to the famous cheesesteak venues.
One promising development from the conference was the SpORts business meeting. It’s good to see the section getting back on its feet, with plans for the future.
Sports like to change their rules lately.
I already knew about the NFL changing the extra point kick distance to punish good kicking.
I already knew about NCAA basketball moving to a 30 second shot clock and getting rid of the 5 second on-ball defending turnover.
I just learned about hockey moving to 3 on 3 overtimes to encourage scoring via more open space on the ice. Looks crazy. Not going to get to shootouts too often anymore.
Fans are going to love it and the forwards are going to love it. Goalies and ‘D’? Maybe not as much.
Another group that might not like it? Sports researchers. As someone who often uses multiple years of data to make a point, I’ll just say that changing the rules makes analysis difficult. Stop doing it so often.
The more things change, the less they stay the same.
The Kelley School of Business at Indiana University hosted a Healthcare Conference on “Patient-Centric Healthcare Management in the Age of Analytics” last Friday and Saturday. I was able to attend on Friday and enjoyed the conference. Special thanks go out to Kurt Bretthauer for organizing the conference and special issue of POM attached to the conference. There were over 70 talks, with 2-3 parallel tracks allowing for 15 minutes/talk.
A couple interesting talks to me:
A group from the University of Cincinnati and Cincinnati Children’s Hospital (Elham Torabi, Craig Froehle, and Christopher Miller) are looking at the triage of patients classified to be “level 3” on the ESI triage scale. The simplest cases of those patients could probably be seen in the Fast Track, alleviating strain on the emergency department during busy times. This dovetails nicely with my work on triaging patients calling EMS for an ambulance transport.
A group from the College of William and Mary and the Bon Secours Health System (Jim Bradley, Chalit Fernando, and Rajiv Kohli) used survey data to identify patient perceptions of hospitals. The data are strongly correlated, making typical regression models difficult, so the group uses PCA in their exploratory analysis to reduce the dimensionality and correlations in the data. The principle components are then incorporated into a stepwise regression to determine the appropriate model. While I wasn’t particularly interested in their problem, I thought it was cool that PCA and stepwise regression were being used together. I haven’t seen either of them used in an operations management paper lately.
From a 2004 paper by Gaba et al:
If a contestant has the opportunity to modify the distribution of her performance, what strategy is advantageous? When the proportion of winners is less than one-half, a riskier performance distribution is preferred; when this proportion is greater than one-half, it is better to choose a less risky distribution. Using a multinormal model, we consider modifications in the variability of the distribution and in correlations with the performance of other contestants. Increasing variability and decreasing correlations lead to improved chances of winning when the proportion of winners is less than one-half, and the opposite directions should be taken for proportions greater than one-half. Thus, it is better to take chances and to attempt to distance oneself from the other contestants (i.e., to break away from the herd) when there are few winners; a more conservative, herding strategy makes sense when there are many winners.
Applications to academia:
For example, if a school wants to be more innovative and nurture high-risk, high-payoff “big ideas,” it should decrease p (of tenure) for junior faculty…
There are also implications regarding the type of individual who might join the organization. For example, consider a new Ph.D. entering academia with a choice between a school with moderate research expectations and reasonably high p (of tenure) and a top research school with low p but greater rewards associated with winning the tenure contest. An organization wanting to minimize the chance of very low performance and/or to attract people who prefer to stay on well-trodden paths should set p high, whereas an organization wanting to increase the chance of especially high performance (at the cost of an increased chance of especially low performance) and/or to attract people who are competitive and like the challenge of striking off in new directions should set p low.
I read 212 research papers in the 12 months following June 2014. Some were for coursework. Some were for research. Some were just because I felt like it.
As anyone who knows me will tell you, my memory for details is not very good. I’m more of a big picture person. So I worry that I won’t retain much from this giant expenditure of time in reading research papers.
I’d like to describe my current system for saving information from research papers for later use. I have a few use cases for this effort:
Use Case 1: Upon writing a research paper, I want to know which papers I’ve read about the topic so that the literature review moves more smoothly.
Use Case 2: When I go to interview for a job at a university, I’d like to know which papers I’ve read from the faculty there. This may provide opening discussion topics.
Use Case 3: I’d like to save my ideas for follow-up actions (after reading papers) in one place.
Use Case 4: When topics in diverse fields reference the same topic, I’d like to be the person to connect the fields.
LOW TECH SOLUTION:
Last year, I saved the first page of every research paper I read in a binder with my hand-written notes on the first page. This provides a form of storage, but it is not at all searchable or cross-reference-able.
HIGH TECH SOLUTION:
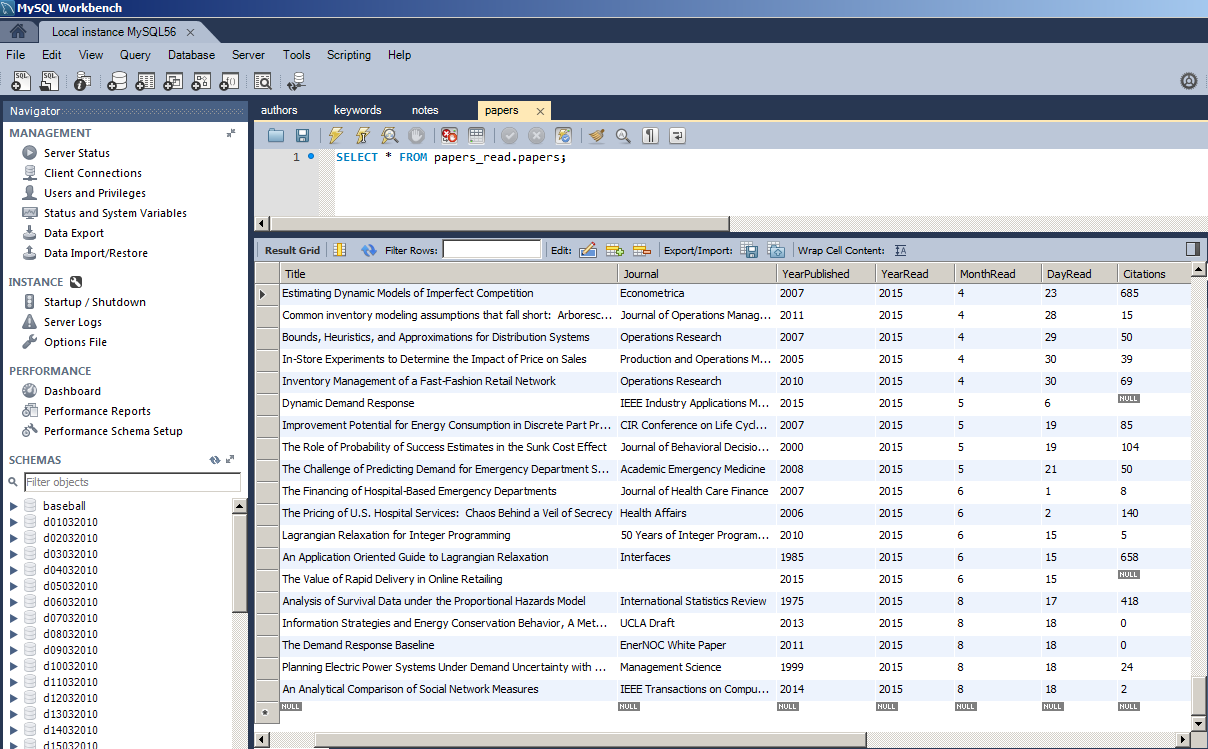
This year, I designed a template that contains all the information about a paper that I want to save. I then designed an import process to port this information from the template (text document) to a database that I can query easily. Here is my process for that, including code and database setup:
1. Install MySQL (https://www.mysql.com/) locally on your most-used computer.
2. Create a database called “papers_read”.
3. Run the code in the attached files to create your database tables (The code is attached here as .txt because my website doesn’t allow me up to upload .sql. Just fix the extension so it is “.sql”): papers, authors, keywords, and notes.
4. Create a folder on your computer called “Paper Notes to Upload”. Put the following template file in the folder: template.
5. Install Python and the related library MySQLdb.
6. Save this Python code wherever you save your code: addNewFromTemplate (again, the extension has been changed to .txt for security reasons. Rename to .py). Update the “folder_to_add” directory in the code to point to the folder you created in step 4.
Now, whenever you read a paper:
A. Fill out the template with the paper details, and save the text file as something OTHER than ‘template.txt’ in the folder created in step 4.
B. When it is convenient (there may be multiple files to upload in the “Paper Notes to Upload” folder), run the Python code. This will upload your notes to the database.
C. Move the paper notes out of “Paper Notes to Upload” folder after uploading. If you run the code again with them still in the folder, they will be uploaded again.
Some notes on the template:
-Do not use colons in any of the fields you save, as the code uses colons to parse the document. If the title of the paper has a colon in it, use a comma instead.
-I grab the number of citations from Google Scholar by searching for the title of the paper.
-“Comma-separated Keywords” is for you to list the keywords in the paper, with a comma between each.
-In the authors section, be sure to delete any extra/unused author spaces. Feel free to add more if necessary, following the pattern of the first 6.
-Under Reading Details, the Hours to Read is how long it took you to read the paper in hours (can be decimal). The Not Read is a place to list sections/pages not read. The Skimmed is a place to list sections/pages quickly skimmed for which another read would be necessary to understand all the details. Reason Read is a reminder of why you read the paper. Methodology Used lets you list the methods used in the paper (i.e. survey, lab experiment, mathematical model, optimization, etc.), if that is relevant to your work.
-Under My Notes, “Keywords for me” lets you list more keywords that the paper did not list itself (comma-separated, again). FollowUp lets you list actions that should be done after reading the paper. Note1 through Note5 let you list notes to yourself about the paper. Limit each note to 200 characters and do not add more. No need to delete unused notes.
I hope this helps. It’s the process I use. Feel free to alter to fit your needs. Let me know if you use it and if you have any questions. All the code is my own and it is fairly fragile (but works for me); feel free to let me know if you have issues or a better solution.
Presentations I will be giving at INFORMS 2015, Nov 1-4:
1. Cluster: Manufacturing & Service Oper Mgmt/Sustainable Operations
Session Information : Sunday Nov 01, 13:30 – 15:00
Session Title: Incentives and Investment in Renewable Energy and Energy Efficiency
Title: Demand Response, Energy Efficiency, And Capacity Investments In A Production Line
Presenting Author: Eric Webb,Graduate Student, Indiana University
Co-Author: Owen Wu,Indiana University
Abstract: Demand response (DR) programs incentivize industrial firms to halt production during times of peak electricity demand. We consider a firm faced with the option of investing in energy efficiency (EE) improvements at individual machines on the production line. When viewed in isolation, EE incentives may not be enough to induce the firm to invest in the socially optimal level of EE, due to the loss of DR revenue after installation. We suggest a new policy for EE incentives in light of DR.
2. Cluster: Manufacturing & Service Oper Mgmt/Healthcare Operations
Session Information: Tuesday Nov 03, 16:30 – 18:00
Session Title: Patients and Practice: Using the Right Resources to Deliver Care
Title: Incentive-compatible Prehospital Triage In Emergency Medical Services
Presenting Author: Eric Webb,Graduate Student, Indiana University
Co-Author: Alex Mills,Assistant Professor, Indiana University
Abstract: The Emergency Medical Services (EMS) system is designed to handle life-threatening emergencies, but a large and growing number of non-emergency patients seek healthcare through EMS. We evaluate the incentives underlying prehospital triage, where EMS staff are allowed to identify patients that could be safely diverted away from the hospital and toward appropriate care. Continued transition from fee-for-service payments to bundled payments may be necessary for prehospital triage implementation.
3 (I will be presenting). Cluster: Behavioral Operations Management
Session Information: Wednesday Nov 04, 08:00 – 09:30
Session Title: Behavioral Models in Operations Management
Title: Linking Customer Behavior And Delay Announcements Using A Probability Model
Presenting Author: Qiuping Yu,Assistant Professor, Indiana University
Co-Author: Kurt Bretthauer,Professor, Indiana University
Eric Webb,Graduate Student, Indiana University
Abstract: Service systems often offer announcements to customers about their anticipated delay. We empirically examine how announcements affect queue abandonment behavior using a duration model accounting for potential behavioral factors. Our results show announcements induce the reference effect and customers exhibit loss aversion. We also find evidence indicative of the sunk cost fallacy. We then provide insights for staffing and delay announcement policy accounting for observed behavioral factors.
4 (poster). Title: Using Past Scores and Regularization to Create a Winning NFL Betting Model
Presenting Author: Eric Webb, Graduate Student, Indiana University
Co-Author: Wayne Winston, Professor, University of Houston
Abstract: Is the National Football League betting market efficient? We have devised a profitable betting model that would win 52.9% of the 7,554 bets against the spread it would have made over 33 seasons. Scores from previous weeks are used to estimate the point value of each team’s offense and defense. These values predict next week’s scores, and a bet is placed against the advertised spread. The sum of squares of offensive/defensive point values are constrained to be less than a regularization constant.
My poster will be presented 12:30-14:30 on Monday, Nov. 2, so I have presentations every day of the conference. Come see me!
Alex Mills and I submitted “Incentive-Compatible Prehospital Triage in Emergency Medical Services” to MSOM today! That project started in January 2014 and has evolved significantly since its start. I think the final paper turned out really well. I’ve updated my Current Projects page to be more relevant.
Abstract for submitted work: The Emergency Medical Services (EMS) system is designed to handle life-threatening emergencies, but a large and growing number of non-emergency patients are accessing hospital-based healthcare through EMS. A recent national survey estimated that 17% of ambulance trips to hospital Emergency Departments (EDs) were medically unnecessary, and that medically unnecessary trips make up an increasing proportion of all EMS trips. These non-emergency patients are a controllable arrival stream that can be re-directed to an appropriate care provider, reducing congestion in EDs, reducing costs to patients and healthcare payers, and improving patient health, but prehospital triage to identify these patients is almost never implemented by EMS providers in the United States. Using a queueing model with economic costs and rewards, we find that prehospital triage is unlikely to occur with traditional fee-for-service reimbursements, regardless of how effective or accurate the triage process may be. However, offering bundled payments to EMS providers would provide them with an incentive to conduct prehospital triage, and, moreover, with incentive to improve their triage effectiveness.
I built a model akin to my NFL betting model that gives each NCAA basketball team an offense coefficient and defense coefficient. The offense coefficient represents how many points above average the team is expected to score. The defense coefficient represents the number of points above average the team gives up on defense. Thus, the prediction for the Kentucky Wildcats in their first game against Hampton on Thursday would be
Wildcats prediction = mean score + Kentucky offense coefficient + Hampton defense coefficient = 66.84 + 11.26 + 5.20 = 83.3
In non-neutral site games, there is a 1.5 point addition to the home team and 1.5 subtraction from the away team. I just consider all NCAA games neutral site games, despite one fanbase normally being closer.
Some interesting notes about the offense, defense, and overall (offense-defense) coefficients for each team:
1. 5 tourney teams have a negative overall coefficient: N Dakota St (-1.2), Lafayette (-1.5), Robert Morris (-2.0), TX Southern (-3.9), and Hampton (-6.9).
2. The best non-tournament team is the Florida Gators at +12.3 overall (1.0 above average on offense and allow 11.3 points less than average on defense). Other good non-tournament teams were Illinois (+12.1 overall), Miami (+11.3), Minnesota (+11.2), Stanford (+11.0), Syracuse (+10.8), and Vanderbilt (+10.6).
3. The worst team in the 351-team NCAA this year was Grambling, with a -28.3 overall coefficient (slightly more terrible than Kentucky (+27.8) is awesome).
4. The 3rd best teams got a #2 seed: Arizona (+23.5)
5. Ohio State is the 11th best team in the nation by this metric, with a +19.0 overall. They are a #10 seed.
6. Indiana is 37th best in the tournament (+11.9), making their #10 seed appropriate.
Here are the offense, defense, and overall (offense-defense) coefficients for all NCAA teams. In Tournament = 1 for tournament teams and 0 for non-invitees. Thus, the Kentucky Wildcats are the strongest team in the field (obviously) and the Hampton Pirates are the weakest.
Team,In Tournament,Offense,Defense,Overall
Kentucky,1,11.25960306,-16.57318803,27.83279109
Wisconsin,1,9.115671943,-14.68432901,23.80000096
Arizona,1,12.40809289,-11.11432937,23.52242226
Duke,1,17.39059681,-5.474975439,22.86557225
Villanova,1,12.56022043,-9.750654145,22.31087458
Virginia,1,1.805020066,-19.6773667,21.48238677
Gonzaga,1,13.04747379,-8.207122475,21.25459626
Utah,1,6.235327975,-13.92119987,20.15652785
North Carolina,1,16.66244203,-3.31654816,19.97899019
Ohio St,1,11.70042955,-7.2802724,18.98070195
Oklahoma,1,9.516156382,-9.102721052,18.61887743
Kansas,1,10.847503,-7.259423534,18.10692654
Notre Dame,1,14.45949873,-3.48248196,17.94198069
Iowa St,1,16.29635719,-1.636044635,17.93240182
Baylor,1,6.647621065,-11.11977291,17.76739397
Louisville,1,5.711179709,-11.3695919,17.08077161
Michigan St,1,9.189558128,-7.119456585,16.30901471
Texas,1,5.376367565,-10.36320387,15.73957144
Butler,1,4.93350344,-10.61264068,15.54614412
West Virginia,1,11.20009757,-3.89932305,15.09942062
Georgetown,1,7.42827321,-7.230947384,14.65922059
Wichita St,1,4.651308633,-9.995758816,14.64706745
Iowa,1,6.336631418,-8.207893165,14.54452458
Xavier,1,10.87039446,-3.376334191,14.24672865
BYU,1,17.86536531,4.230098624,13.63526668
Arkansas,1,14.01347164,0.536361194,13.47711045
Providence,1,7.403010189,-5.813107989,13.21611818
Davidson,1,13.88838228,1.01852462,12.86985766
Oklahoma St,1,5.063517753,-7.624884597,12.68840235
Maryland,1,5.260574173,-7.371466112,12.63204029
NC State,1,7.616708866,-4.959370502,12.57607937
SMU,1,4.67010389,-7.631662887,12.30176678
VA Commonwealth,1,8.8726408,-3.412780509,12.28542131
Purdue,1,5.715193397,-6.303977647,12.01917104
Northern Iowa,1,0.495397908,-11.47349107,11.96888898
Indiana,1,13.71244271,1.849928621,11.86251409
Georgia,1,5.246141864,-6.450354598,11.69649646
San Diego St,1,-2.880506251,-14.16467921,11.28417296
St John’s,1,6.507087478,-4.69088311,11.19797059
Mississippi,1,9.030576775,-1.882864659,10.91344143
UCLA,1,8.400883474,-2.449929352,10.85081283
LSU,1,10.02410226,-0.453060944,10.47716321
Boise St,1,5.079430746,-5.175186054,10.2546168
Dayton,1,2.775584578,-7.259294845,10.03487942
Oregon,1,9.985403864,-0.010738454,9.996142318
SF Austin,1,8.348589146,-1.539344608,9.887933754
Cincinnati,1,-1.807592319,-11.44615051,9.638558194
Buffalo,1,9.329858916,0.376408928,8.953449987
Valparaiso,1,0.15520871,-6.691053229,6.846261939
Georgia St,1,2.769249095,-3.563044014,6.332293109
Harvard,1,-2.762281708,-7.711752657,4.949470948
New Mexico St,1,1.066980071,-3.361550501,4.428530572
UC Irvine,1,0.376535358,-3.892116978,4.268652337
Wyoming,1,-4.218604803,-8.141358983,3.922754179
Wofford,1,-4.276188352,-7.693278281,3.417089929
Northeastern,1,1.325841741,-1.486661314,2.812503056
E Washington,1,9.798037894,7.785407386,2.012630508
UAB,1,2.006062461,0.426427327,1.579635134
North Florida,1,4.791860857,3.619065323,1.172795534
Belmont,1,5.770113057,4.616958017,1.15315504
Albany NY,1,-2.375194726,-3.38255515,1.007360424
Manhattan,1,2.220402645,2.050065064,0.170337581
Coastal Car,1,-0.728206243,-0.892579425,0.164373182
N Dakota St,1,-5.175674886,-3.955373727,-1.22030116
Lafayette,1,5.527468982,7.001728579,-1.474259597
Robert Morris,1,-0.696576107,1.333643168,-2.030219274
TX Southern,1,-1.080044415,2.798343678,-3.878388093
Hampton,1,-1.718260145,5.197706658,-6.915966804
Florida,0,0.996067845,-11.33750928,12.33357713
Illinois,0,5.882193229,-6.2444598,12.12665303
Miami FL,0,4.779889622,-6.567139055,11.34702868
Minnesota,0,10.00642965,-1.237734366,11.24416402
Stanford,0,7.736198076,-3.249591011,10.98578909
Syracuse,0,4.023281648,-6.733093345,10.75637499
Vanderbilt,0,6.16894547,-4.425327329,10.5942728
TCU,0,3.516369996,-6.973175241,10.48954524
Texas A&M,0,2.998572582,-7.322350985,10.32092357
South Carolina,0,1.336055443,-8.373694142,9.709749586
Rhode Island,0,1.005201751,-8.011815191,9.017016942
Alabama,0,3.066385132,-5.901676955,8.968062087
St Mary’s CA,0,3.917216482,-4.898745141,8.815961623
Colorado St,0,7.02833787,-1.554791865,8.583129736
Arizona St,0,6.02690996,-2.476773765,8.503683726
Michigan,0,0.877866017,-7.593902313,8.471768329
Richmond,0,0.108423704,-8.135753766,8.24417747
G Washington,0,0.738652361,-7.485228151,8.223880511
Kansas St,0,0.56311114,-7.291471364,7.854582504
Connecticut,0,0.546308868,-7.256523952,7.80283282
Old Dominion,0,-2.583918381,-10.22972448,7.645806098
Pittsburgh,0,2.774298368,-4.782916275,7.557214643
Seton Hall,0,5.075389094,-2.188857722,7.264246816
Illinois St,0,3.310061022,-3.868796641,7.178857663
Temple,0,0.483946384,-6.619582979,7.103529363
Penn St,0,3.408222207,-3.578297067,6.986519273
Colorado,0,3.742999136,-3.106254664,6.8492538
Tulsa,0,-1.01719754,-7.812501635,6.795304095
Murray St,0,9.662263907,2.877460936,6.784802971
Creighton,0,3.596779064,-3.175563273,6.772342337
WI Green Bay,0,0.795453247,-5.864845897,6.660299145
C Michigan,0,6.725853259,0.069096683,6.656756576
Clemson,0,-2.285782543,-8.833162927,6.547380384
Memphis,0,3.122080408,-3.129715098,6.251795506
Tennessee,0,-0.267994897,-6.457120999,6.189126102
Georgia Tech,0,-0.030724561,-6.151813181,6.12108862
Louisiana Tech,0,5.253106516,-0.799176422,6.052282938
Marquette,0,1.165456059,-4.86156217,6.027018229
Toledo,0,8.578017189,2.728087637,5.849929552
San Diego,0,-1.025327829,-6.594883322,5.569555493
Florida St,0,3.282123663,-2.213762341,5.495886005
UTEP,0,1.581857002,-3.904976051,5.486833053
Northwestern,0,-0.737608463,-6.01573569,5.278127227
Hofstra,0,9.833004258,4.62114795,5.211856309
Nebraska,0,-2.696072651,-7.847774707,5.151702056
Boston College,0,2.500114823,-2.638529732,5.138644555
UNLV,0,3.293830258,-1.828045426,5.121875684
Yale,0,0.185367176,-4.894610087,5.079977263
Oregon St,0,-6.489120942,-11.54293161,5.05381067
Iona,0,12.28698365,7.270781316,5.016202334
Pepperdine,0,-2.178180403,-7.175283574,4.997103171
La Salle,0,-1.03653008,-5.857597335,4.821067255
Washington,0,4.156108142,-0.618865535,4.774973677
Bowling Green,0,-0.424303031,-5.08513009,4.660827059
Santa Barbara,0,1.896456566,-2.589519779,4.485976346
California,0,1.534051995,-2.890370245,4.424422241
Sam Houston St,0,-0.926371758,-5.228182006,4.301810248
S Dakota St,0,3.428221093,-0.687036962,4.115258055
St Bonaventure,0,1.373054482,-2.697319726,4.070374209
Akron,0,-0.17813198,-4.189479929,4.01134795
William & Mary,0,5.483831383,1.511800151,3.972031232
Portland,0,4.28489534,0.496046721,3.788848619
Wake Forest,0,5.154787094,1.470510028,3.684277066
Cleveland St,0,-1.730484523,-5.315557291,3.585072767
Massachusetts,0,4.503996491,1.110706026,3.393290465
San Francisco,0,2.97935543,-0.405108429,3.384463859
UC Davis,0,3.458902259,0.189379994,3.269522265
Texas Tech,0,-3.005620131,-6.050017736,3.044397606
Utah St,0,1.266698553,-1.750632529,3.017331082
E Michigan,0,-0.069977381,-2.923037331,2.85305995
Kent,0,-1.372694097,-4.184148526,2.811454429
New Mexico,0,-3.3279385,-6.026888695,2.698950195
Hawaii,0,4.965419489,2.276244932,2.689174557
Vermont,0,-2.038140582,-4.636356501,2.598215919
Long Beach St,0,0.957426082,-1.609106209,2.566532291
NC Central,0,-5.512535911,-8.067988604,2.555452693
DePaul,0,6.187197872,3.670162662,2.51703521
Evansville,0,1.896656286,-0.569755704,2.466411989
Auburn,0,5.267195181,2.807346188,2.459848993
Charlotte,0,8.209179424,5.972521795,2.236657629
W Michigan,0,4.242939745,2.229910356,2.013029389
Loyola-Chicago,0,-3.446573915,-5.40821774,1.961643825
ULL,0,6.463796634,4.664775705,1.799020929
Stony Brook,0,-1.742689358,-3.529018073,1.786328715
Mississippi St,0,-3.041778822,-4.760184818,1.718405996
W Kentucky,0,2.773718189,1.296815487,1.476902702
E Kentucky,0,-0.454632855,-1.901837933,1.447205078
USC,0,2.54844928,1.285713324,1.262735956
MTSU,0,-3.692019264,-4.619562797,0.927543533
Ga Southern,0,-2.976804328,-3.727874955,0.751070627
Cal Poly SLO,0,-6.592110567,-7.306101365,0.713990798
Morehead St,0,0.622256647,-0.053323399,0.675580046
Virginia Tech,0,0.763899728,0.306864648,0.45703508
Columbia,0,-2.86763066,-3.275757059,0.408126399
Missouri,0,-2.917653075,-3.063573326,0.145920252
Canisius,0,-3.63213316,-3.619946054,-0.012187106
Oakland,0,7.252157994,7.334114287,-0.081956293
St Joseph’s PA,0,-3.225039641,-3.087439478,-0.137600163
Santa Clara,0,-2.412328389,-2.227071553,-0.185256836
Princeton,0,1.086117859,1.33258349,-0.246465631
SC Upstate,0,-1.599832112,-1.245130116,-0.354701996
Rutgers,0,-3.394469345,-2.992765939,-0.401703406
FL Gulf Coast,0,-2.281612458,-1.87648001,-0.405132448
Washington St,0,6.566108571,6.978309486,-0.412200914
Rider,0,-2.316368694,-1.741170355,-0.575198339
Montana,0,0.144235667,0.803924985,-0.659689318
N Illinois,0,-2.806057038,-2.034933594,-0.771123445
Chattanooga,0,1.059492109,1.852849239,-0.79335713
UNC Wilmington,0,1.268403577,2.064525859,-0.796122282
St Francis NY,0,-1.463772125,-0.636722353,-0.827049773
Indiana St,0,1.66175481,2.578660309,-0.916905498
Quinnipiac,0,2.200067917,3.158129085,-0.958061168
High Point,0,1.900669964,2.868520511,-0.967850547
Mercer,0,-3.614651612,-2.623296311,-0.991355302
Dartmouth,0,-3.522651292,-2.423691485,-1.098959806
Monmouth NJ,0,-3.118569654,-1.831730572,-1.286839082
Colgate,0,-1.683976191,-0.322847015,-1.361129177
ULM,0,-7.644379082,-6.252107969,-1.392271113
American Univ,0,-9.122727235,-7.610655179,-1.512072056
TN Martin,0,-0.499581707,1.013601276,-1.513182984
George Mason,0,-0.885944355,0.703640161,-1.589584516
Lehigh,0,-0.491650582,1.123443391,-1.615093973
St Peter’s,0,-7.07505769,-5.396715626,-1.678342064
Air Force,0,-0.941462427,0.737962363,-1.67942479
Detroit,0,2.115567729,3.810647191,-1.695079461
New Hampshire,0,-2.884150021,-1.157638038,-1.726511983
Fresno St,0,-0.231732419,1.626203669,-1.857936088
NJIT,0,0.373113264,2.343502036,-1.970388772
Tulane,0,-2.868324193,-0.779169392,-2.089154801
IPFW,0,0.35985052,2.565490089,-2.205639568
Rice,0,-2.580430452,-0.370472159,-2.209958294
Fordham,0,-0.967340218,1.256931199,-2.224271417
Winthrop,0,1.399083918,3.624457093,-2.225373174
James Madison,0,-0.613762944,1.653648672,-2.267411616
Cornell,0,-4.846105379,-2.431923334,-2.414182045
UT Arlington,0,4.028142635,6.448471202,-2.420328567
Houston,0,-1.729708745,0.76160125,-2.491309995
Northern Arizona,0,-2.072605406,0.508621675,-2.581227082
Bucknell,0,0.57640413,3.166643318,-2.590239188
Norfolk St,0,0.495207954,3.112632027,-2.617424073
UT San Antonio,0,2.613381863,5.245869209,-2.632487346
Pacific,0,-2.297038228,0.420016776,-2.717055004
Duquesne,0,5.711658999,8.595133114,-2.883474115
Radford,0,0.375015585,3.287930187,-2.912914601
Northwestern LA,0,14.22450637,17.23378187,-3.009275506
East Carolina,0,-3.712050931,-0.611834791,-3.10021614
Oral Roberts,0,0.419988084,3.630057691,-3.210069607
Charleston So,0,1.943414414,5.205023434,-3.26160902
Miami OH,0,-0.415209768,2.866242056,-3.281451824
ETSU,0,2.471736539,5.912212678,-3.440476139
S Illinois,0,-6.157573226,-2.700533146,-3.45704008
Denver,0,-6.565471623,-3.102845593,-3.46262603
Ohio,0,0.936426727,4.488960018,-3.552533292
CS Sacramento,0,-1.288859955,2.273181756,-3.562041712
Incarnate Word,0,7.402196168,10.98088307,-3.578686899
UC Riverside,0,-2.784617596,0.884981819,-3.669599415
St Francis PA,0,-5.233595214,-1.397568201,-3.836027013
Gardner Webb,0,5.001842641,8.857140967,-3.855298326
South Dakota,0,1.06893918,4.949976457,-3.881037277
Loy Marymount,0,-2.883562536,1.051555203,-3.935117739
Ball St,0,-1.503277507,2.495559789,-3.998837296
WI Milwaukee,0,-2.349322524,1.678582951,-4.027905474
Texas St,0,-9.269064091,-5.215836621,-4.05322747
Boston Univ,0,0.982871516,5.107878359,-4.125006843
TAM C. Christi,0,-5.456215952,-1.260433079,-4.195782874
MD E Shore,0,-0.998300235,3.252011703,-4.250311938
SE Missouri St,0,-0.3483239,3.951216473,-4.299540373
W Carolina,0,0.922386169,5.346115246,-4.423729077
Idaho,0,6.066138593,10.51756029,-4.451421693
North Texas,0,-3.647670704,0.839912215,-4.487582919
E Illinois,0,-5.989082465,-1.445421848,-4.543660616
Mt St Mary’s,0,-5.56359457,-0.934424092,-4.629170478
Bryant,0,-2.195357379,2.518425931,-4.71378331
Ark Little Rock,0,0.547467282,5.298663714,-4.751196432
Elon,0,-0.240354127,4.511183657,-4.751537785
Bradley,0,-8.37664549,-3.592307402,-4.784338088
Holy Cross,0,-2.928888871,1.896180072,-4.825068943
Army,0,2.772384133,7.849327861,-5.076943729
Tennessee Tech,0,0.826315101,5.905836797,-5.079521696
Missouri St,0,-5.616194331,-0.512754846,-5.103439485
Drexel,0,-7.625302857,-2.477440262,-5.147862595
Wright St,0,-4.752418536,0.401458146,-5.153876683
South Florida,0,-3.593079227,1.715871166,-5.308950393
N Kentucky,0,-2.04398871,3.289056831,-5.333045541
CS Bakersfield,0,-6.588338225,-1.203099074,-5.385239151
UNC Asheville,0,1.03391908,6.583641461,-5.549722381
N Colorado,0,3.018838259,8.580062997,-5.561224738
Towson,0,-5.610522012,0.093104863,-5.703626875
Sacred Heart,0,3.919829138,9.693034193,-5.773205055
CS Northridge,0,-1.852929275,3.98571557,-5.838644845
Nevada,0,-5.594594316,0.298487562,-5.893081878
St Louis,0,-6.386710515,-0.470035566,-5.916674949
Siena,0,2.208504419,8.241529361,-6.033024942
Brown,0,-0.470367695,5.57497357,-6.045341265
NE Omaha,0,8.090192449,14.18870399,-6.098511539
Marshall,0,-0.746519536,5.420578306,-6.167097842
Edwardsville,0,-3.205022245,3.049733763,-6.254756008
Drake,0,-5.775067885,0.484753049,-6.259820935
Weber St,0,-5.211653126,1.068924264,-6.28057739
Grand Canyon,0,-0.32446925,6.027983046,-6.352452296
Portland St,0,-0.402864831,5.95596998,-6.358834811
UCF,0,0.335665962,6.712550523,-6.376884562
Col Charleston,0,-9.322829761,-2.943662251,-6.37916751
Florida Intl,0,-5.612210274,0.827017816,-6.43922809
Youngstown St,0,3.484870625,9.980632972,-6.495762348
Delaware,0,-1.259239891,5.399725796,-6.658965687
Navy,0,-7.905711572,-1.190380118,-6.715331454
Seattle,0,-7.203145318,-0.448100722,-6.755044596
Missouri KC,0,-4.373760955,2.382282137,-6.756043093
Alabama St,0,-1.178961346,5.660603645,-6.839564991
FL Atlantic,0,-4.85179156,2.065263763,-6.917055323
Hartford,0,-5.869510096,1.061818559,-6.931328656
UNC Greensboro,0,-2.101102747,4.909633938,-7.010736685
Penn,0,-5.478463923,1.677572732,-7.156036654
IUPUI,0,-6.724834299,0.512185498,-7.237019797
Howard,0,-9.390006486,-2.074338898,-7.315667587
Long Island,0,-1.419296926,5.933529667,-7.352826593
IL Chicago,0,-3.1003701,4.327083122,-7.427453222
Troy,0,-3.157157684,4.44839154,-7.605549224
Lamar,0,-2.009235767,5.676802956,-7.686038722
Southern Univ,0,-7.471546862,0.311625385,-7.783172247
CS Fullerton,0,-2.307880755,5.514573128,-7.822453883
Fairfield,0,-8.120293998,-0.199553647,-7.920740351
Delaware St,0,0.148669139,8.129307178,-7.980638039
South Alabama,0,1.781854161,10.03723734,-8.255383176
Samford,0,-1.200207241,7.085620712,-8.285827953
Prairie View,0,-1.715864997,6.70249149,-8.418356487
McNeese St,0,-4.587011656,3.838570856,-8.425582513
Niagara,0,-3.196683094,5.232712619,-8.429395713
Appalachian St,0,-4.901144942,3.578007172,-8.479152114
VMI,0,8.928041167,17.64065666,-8.712615495
Lipscomb,0,1.33506164,10.07697614,-8.741914502
SE Louisiana,0,-3.374385406,5.487942074,-8.862327481
Arkansas St,0,-5.398963875,3.581289279,-8.980253154
MA Lowell,0,-7.216633641,1.879708372,-9.096342013
Loyola MD,0,-8.271863321,1.040031911,-9.311895231
Furman,0,-6.2476101,3.1446892,-9.392299299
Campbell,0,-8.76002721,0.634768747,-9.394795957
Marist,0,-7.520361471,1.918982391,-9.439343862
Southern Miss,0,-7.505483926,1.964986683,-9.470470609
Wagner,0,-0.593898955,9.089303794,-9.68320275
New Orleans,0,-1.686582927,8.081602857,-9.768185784
Idaho St,0,-6.497892904,3.63759944,-10.13549234
Jackson St,0,-10.01001642,0.226799093,-10.23681551
Southern Utah,0,-0.966744398,9.541382221,-10.50812662
F Dickinson,0,-2.323451205,8.312831631,-10.63628284
North Dakota,0,-2.267420963,8.398692971,-10.66611393
Houston Bap,0,-1.160294673,9.803285498,-10.96358017
Jacksonville St,0,-7.752549583,3.291861773,-11.04441136
Austin Peay,0,-4.948736469,6.20067653,-11.149413
Longwood,0,-3.22795396,8.086301508,-11.31425547
Utah Valley,0,-11.17313608,0.232802957,-11.40593904
Montana St,0,-6.179269638,5.520533516,-11.69980315
Binghamton,0,-9.675342685,2.065992679,-11.74133536
Citadel,0,-7.348762049,4.484239091,-11.83300114
W Illinois,0,-7.913298207,4.962000519,-12.87529873
TX Pan American,0,-8.234011898,4.795520933,-13.02953283
Chicago St,0,-12.15960884,1.24969145,-13.40930029
Ark Pine Bluff,0,-10.38078872,3.080324954,-13.46111367
Tennessee St,0,-11.1653286,2.302534256,-13.46786286
Bethune-Cookman,0,-13.98129854,-0.381930917,-13.59936762
Nicholls St,0,-8.15134421,5.745910117,-13.89725433
Morgan St,0,-7.660614348,6.452347539,-14.11296189
Stetson,0,-4.971428348,9.326606928,-14.29803528
UMBC,0,-10.81376601,3.534758145,-14.34852416
Liberty,0,-8.985824119,5.573471015,-14.55929513
NC A&T,0,-10.51972732,4.041732807,-14.56146013
Alabama A&M,0,-8.929831708,5.785563128,-14.71539484
Presbyterian,0,-9.771610519,5.032594445,-14.80420496
Jacksonville,0,-6.317416348,8.558836805,-14.87625315
S Carolina St,0,-10.34049138,4.655714868,-14.99620625
Central Conn,0,-9.767524448,5.419515775,-15.18704022
Abilene Chr,0,-9.442635939,5.760057141,-15.20269308
Kennesaw,0,-6.998986438,8.588047505,-15.58703394
Coppin St,0,3.650463135,19.36687571,-15.71641258
Maine,0,-5.85945427,9.951243892,-15.81069816
Savannah St,0,-12.70797586,3.265338239,-15.9733141
San Jose St,0,-12.75446765,3.340359086,-16.09482673
Alcorn St,0,-6.881942805,11.57196986,-18.45391266
Cent Arkansas,0,-5.478359998,15.61111881,-21.08947881
MS Valley St,0,-4.42321955,17.19380121,-21.61702076
Florida A&M,0,-13.3187347,10.49868716,-23.81742186
Grambling,0,-18.45707411,9.855333563,-28.31240767