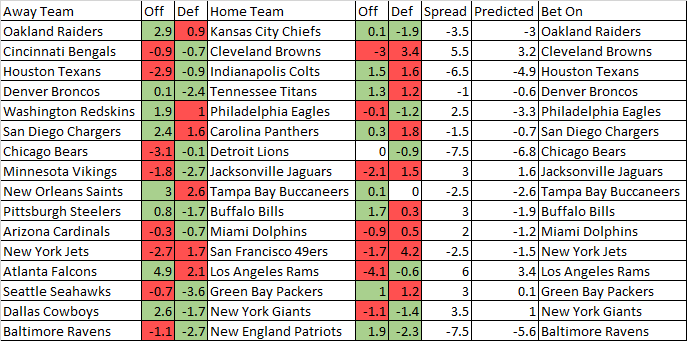
Mama said there’d be years like this, but man oh man… It ain’t workin this year.
Overall Against the Spread: 74-92
Week 2: 8-8
Week 3: 10-6
Week 4: 6-9
Week 5: 5-8 (1 push)
Week 6: 7-6 (2 pushes)
Week 7: 3-11 (1 game not bet)
Week 8: 6-7
Week 9: 5-6 (1 game not bet, 1 push)
Week 10: 8-6
Week 11: 7-4 (1 game not bet, 2 pushes)
Week 12: 5-10 (1 push)
Week 13: 4-11

Have you done any kind of analysis of the misses this year to see if they are typical? Also curious how much have you analyzed historical misses to look for improvements? Could be interesting to plot the year by year cumulative distribution of misses and see if there are any trends.
Have you looked at this season’s misses to see if they are typical for past history? Actually it would be interesting to plot a cumulative distribution of your misses relative to the team that’s favored/home team/better record and see if any patterns emerge over time (like a diminishing or increasing homefield advantage over time).
Sorry Mike, my spam finder thought you were too spammy. Just fixed it today; you should be able to comment again. To everyone else, know that I answered Mike’s question in a brilliant fashion offline.